Saturday, January 11, 2014

Pakistan Gold imports up 87.02pc in July-November 2013 (Imported 3.77 Tons)

ISLAMABAD: The gold imports during the first five months of current fiscal year 2013-14 surged by 87.02 percent as against the same period of last year.
According to data revealed by Pakistan Bureau of Statistics (PBS), during the period under review, 3,427 kilograms of yellow metal worth of US $139.921 million was imported as compared to the import of 1,380 kg valuing $74.815 million during July-November 2012-13.


List of countries by gold production

Click Here To Go To Wikipedia and see The U.s. Geological Survey Data


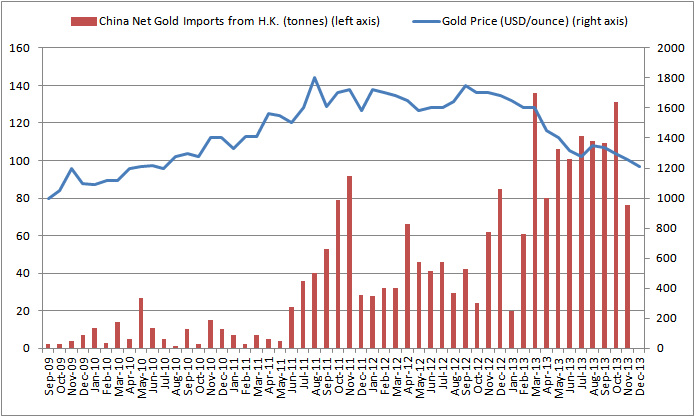
Past 4 Years Gold Imports Into China VS. Gold Price


Record U.S. Gold Bullion Exports Head to Hong Kong & Switzerland


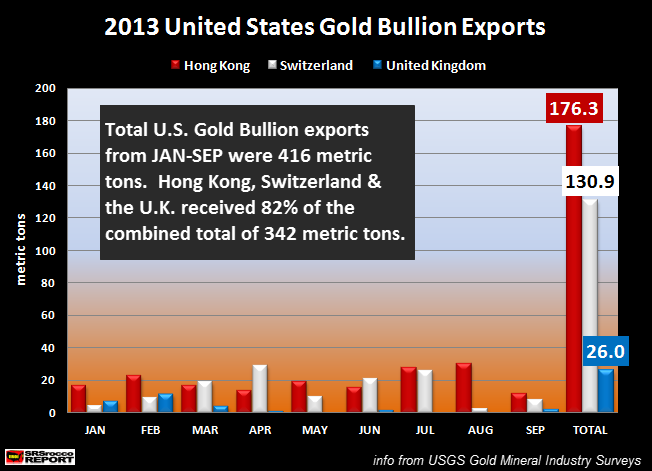
As the Fed continues with its Quantitative Easing policy, U.S. gold bullion exports hit a new record in the first nine months of 2013.  While it’s no secret to anyone in the precious metal community, the majority of U.S. gold exports found their way to Hong Kong and Switzerland.
Not only have gold bullion exports hit new records during Jan-Sept, they have already surpassed the total for 2012.  If we look at the chart below, we can clearly see who has received most of the gold.
2013 Top 3 US Gold Bullion Exports new
In the first nine months of 2013, Hong Kong received 176.3 mt (metric tons), Switzerland 130.9 mt and the United Kingdom 26 mt.  Of the 416 mt of U.S. gold bullion exports Jan-Sept, these three countries received 342 mt or 82% of the total.
Why is this such a big deal?  Because in the first nine months of 2012, total U.S. gold bullion exports were only 283 mt compared to the 416 mt so far this year.  Which means the United States has exported 47% more gold bullion at an additional 133 mt compared to the same period last year.
Furthermore, total U.S. gold bullion exports in 2012 were only 371 mt compared to the 416 mt in the first nine months of 2013.
As the price of gold started to decline in March of this year, including the huge take-down in April, U.S. gold bullion exports picked up significantly:
US Total Gold Bullion Exports
The number of gold bullion exports increased from 40.1 mt in Jan to 62.1 mt in April.  Then we can see they fell in May (38.1 mt) and June (40.7 mt) as the gold buyers were waiting to see if prices would stop falling.  And in June, the price of gold finally bottomed right below $1,200 level.
What is interesting to see here is that there were a higher amount of gold bullion exports in July (64.4 mt) than in April (62.1 mt)
As the price started to rise in July, gold exports to Hong Kong & Switzerland picked up substantially.  The table below details which countries were the recipients of U.S. gold bullion exports.
2013 U.S. Gold Bullion Exports Table
Not only did Hong Kong increase its gold bullion imports from the U.S. in July to 27.9 mt up from 15.5 mt in June, but it jumped even higher in August when it reached a 30.7 mt — a record month for the year.
According to the data from the USGS Gold Mineral Industry Surveys for Jan-Sept 2013, Hong Kong has received a total of 176.3 mt and Switzerland 130.9 mt.  The United Kingdom came in third at 26 mt while Thailand came in fourth at 21. mt, followed by South Africa at 19.5 mt, Canada at 15.3 mt, China at 11 mt and India at 2.7 mt.
There was an additional 13.5 mt that went to several misc. countries in which the United Arab Emirates received the greater share.
Now, I want to make something clear here.  These figures only represent “Gold Bullion” exported out of the United States.  There are also two other categories that come under the heading of gold exports beside manufacturing and scrap supply.  We also have the following:
JAN-SEPT Gold Exports:
Ores & Concentrates = 5.1 metric tons
Dore’ & Precipitates = 152 metric tons
If we add up all the three categories of  U.S. gold exports we have total of 573 metric tons for the first nine months of 2013.  This turns out to be a significant trend when we factor in several other figures.
As U.S. gold exports increased in 2012, its imports have fallen considerably.  The chart below shows the change in U.S. net gold supply:
U.S. Gold Net Supply NEW
The chart is broken down into four components;  Mine Production, Gold Imports, Gold Exports and Net Supply.  There is no real change in U.S. gold mine supply, but we can certainly see that gold imports have fallen off dramatically since 2011.
U.S. gold imports fell to 332 metric tons in 2012 down from 507 metric tons in 2011.  I would imagine overall gold imports in 2013 will be about the same as they were in 2012 when we receive the remaining four months of data from the USGS.
However, the big change here is the large increase of U.S. gold exports.  Total gold exports out of the U.S. increased from 474 mt in 2011 to 693 mt in 2012.  Currently, the United States has exported 573 mt, 45 mt more than the same period last year.
Compiling all the figures  for the past three years (including only Jan-Sept 2013), the United States has a negative 171 mt of net gold supply so far in 2013.  Basically, this means that the U.S. has exported 171 mt more gold than it has produced from its mining sector and imports combined.
In 2011, the U.S. had a positive net supply of 265 mt, but due to high demand for gold abroad this fell in 2012 to a negative 127 mt.  And as you can see, U.S. net gold supply continues to decline — a negative 298 mt since the beginning of 2012.
It will be interesting to see what takes place for the remainder of the year.  If we consider that Hong Kong had record gold imports in October, I would imagine the U.S. supplied a good portion of this amount.
Lastly, when we realize that the majority of U.S. gold exports to Switzerland and the U.K. are probably making their way to the East…. we can assume that the overwhelming majority of the gold leaving the shores of the United States is most certainly ending up in China.

Gold Vault Opens in China as Bullion Goes From West to East

A gold vault that can store 2,000 metric tons, double China’s projected consumption this year, opened in Shanghai this month as owner Malca-Amit Global Ltd. seeks to benefit from rising demand in Asia’s largest economy.
The facility is the biggest for the Hong Kong-based company, and it can also store diamonds, jewelry and art, Joshua Rotbart, precious metals general manager, said in an interview. The site could hold bullion worth about $82.5 billion at today’s price, Bloomberg calculations show. China’s total demand may reach 1,000 tons in 2013, the World Gold Council forecasts.
Consumption in China may increase 29 percent to a record this year, overtaking India as biggest user as lower prices and higher incomes spur demand, according to the WGC. The investment in Shanghai’s new free-trade zone reflects a shift in world demand away from the U.S. and Europetoward Asia. Demand for gold jewelry, bars and coins in Greater China, India, Indonesia andVietnam is now about 60 percent of the global total, up from 35 percent in 2004, according to HSBC Holdings Plc.

Click Below To See A video Of The Vault On Bloomberg

Russian Banks Buy 181.4 Tons Of Gold In 2013


With headlines crowing of gold's worst year since 1981 as a signal that the status quo is winning and proof positive that fiat-currency naysayers must be wrong, it would appear that the rest of the world's central banks (and banks) have used the price depreciation to stack the precious metal. As Bloomberg reports,
  • *RUSSIAN BANKS BOUGHT 181.4 TONS OF RUSSIAN GOLD IN 2013: RIA
  • *RUSSIAN BANKS BOUGHT ALMOST 90% OF RUSSIA 2013 GOLD OUTPUT: RIA
This 5.834 million ounce addition (8.3% YoY) is more than double that of Russia's central bank additions in 2013 with Bitcoin-favoring Sberbank piling up 48.5 tons alone in 2013.

Russia's central bank added 2.485 million ounces to November - so the bank additions are very large...

Biggest buyers according to Finance Ministry include Sberbank (48.5 tons), VTB (38.9 tons), Gazprombank (29.1 tons), Nomos Bank (19.6 tons), Lanta Bank (8.6 tons).
So, like China, we are sure Russia will be sending a big "Thank You" to the Fed (and BIS) for their efforts.

UNPRECEDENTED CHINESE GOLD DEMAND TOPS 2500 TONS IN 2013!!!!

Friday the numbers were released on total Chinese gold demand for 2013. Total demand can be measuredby the amount of physical gold that is withdrawn from the vaults of the Shanghai Gold Exchange. In the last full trading week (#52, December 23 – 27) of 2013 there were 53 tons of physical gold withdrawn, which brings the yearly total to 2181 tons. Yes, total Chinese demand for 2013 was 2181 tons, excluding PBOC purchases. All my sources in the mainland state the PBOC would never buy its gold through the SGE, so total demand including PBOC purchases may have reached well over 2500 tons.  Which would imply total net import was 2000 tons.

There are some really Interesting Graphs In This Article

Click Here To Read More At Ingoldwetrust.com

Gold is no longer a safe investment! (This Is Comical)

The crash in gold prices was one of the biggest shockers of 2013. A correction had already begun at the fag end of 2012, but prices really crashed in 2013, triggered by fears that the US Federal Reserve would scale down and do away with the economic stimulus.


Click Here To Read More At The Times Of India

Friday, January 10, 2014

Turkey’s gold imports hit record in 2013 (Up 150% from 2012)

Turkey’s gold imports jumped to their highest annual level on record in 2013 due to a considerable drop in market prices as well as the country’s ongoing gold-for-gas trade with Iran. Turkey imported 302.3 tons of gold through the 12 months of the year, data from Borsa Istanbul showed, recording a 150 percent rise from the previous year’s level of 120.78 tons.


Click Here To read more at http://www.hurriyetdailynews.com/

Tuesday, January 7, 2014

Yellen Has No Clue How to Run Fed: David Stockman

Long gold, short China is the winning trade so far this year

If you have been wondering what all those old Chinese aunties buying gold were telling us last year then this is it: go long gold and short China. So far in 2014 that has been the winning trade. Gold is sharply up, shares in Shanghai are tumbling.
Actually the Shanghai Composite Index is 60 per cent off its high and has been falling for several years. Gold took a break from its 13-year bull market last year but remains in an uptrend. However, both markets could be set for strong movements this year, albeit in opposite directions.

Thursday, January 2, 2014

Avoid gold: The last correction took 20 years!!!

After gaining more than 700% in the decade following the 9/11 Terrorists attacks, Gold (GLD) has since fallen about 40% from the all time high it hit 15 months ago, with most of that happening in 2013. In fact, the last 12 months have been the second most bruising period for the metal in over a century, bested only by the 32% slump of 1981.

This type of decline is not only rare, but tempting, as many bottom-fishing investors are starting see value in gold, although David Nelson, chief strategist at Belpointe Advisors is not one of them.

“I can’t find a lot of reasons to like gold,” Nelson says in the attached video, citing three reasons for his continued caution.

Click Here To See The Video: Yahoo Video

Gold Restrictions Fuel A Black Market For Gold In India!

Wednesday, January 1, 2014

IRS data shows 50 percent of households make less than $35,000 per year. Top 10 percent pay 68 percent of income taxes.

From Mybudget360.com:

A major theme throughout 2013 revolved around a booming stock market and real estate sector.  Alongside this theme however was also the one of growing income inequality.  The stock market generated one of its best years but only a small portion of the population benefited since most Americans do not own stocks outright.  The real estate boom was largely driven by big money investors leveraging the unprecedented Quantitative Easing machinery from the Federal Reserve.  Yet most households have little access to this debt since deleveraging is still occurring for households.  The only consumer debt sectors to boom in 2013 came from student loans and auto loans. Not exactly two sectors to build up your wealth portfolio.  We see how the great income divide is splitting the nation even when it comes to paying income taxes.  The adjusted gross income for half of households in the US is less than $35,000.  This group pays 11.55 percent of all income taxes.  The top 10 percent pay 68 percent of all income taxes.  This is an expected trend when wealth inequality is at levels last seen in the Gilded Age.

Click Here To Read More At Mybudget360.com

Gold: Declining Prices Versus Skyrocketing Demand!!

This is the reality in the Gold market that the average person has no knowledge of. They see the price dropping and think that the demand must be low!

Thursday, December 26, 2013

Scarcity of Gold in Mexico!

I have just spoken with Mr. Calles, at Banco Azteca. Mr. Calles purchases silver one-ounce “Libertad” coins for sale to the public through the offices of Banco Azteca, throughout Mexico, and thus he is in contact with the Mexican Mint.

After a year, Bundesbank repatriates only 37 of 700 tonnes of gold

Only 37 tons?????? meanwhile China has scooped up a couple thousand tons!!!!!
While Germany's Bundesbank announced a year ago that it would repatriate most of the 700 tonnes of gold it has vaulted with foreign central banks, the Berlin newspaper Bild reported yesterday that only 37 tonnes have been repatriated so far:

BLOOMBERG: LONDON GOLD VAULTS ARE VIRTUALLY EMPTY, ALL THE GOLD HAS BEEN TRANSFERRED TO HONG KONG!

This is incredible. While discussing how the London vaults have been emptied and the gold has made it's way to china all they can think about is how the bull run in the price has ended.


Saturday, December 14, 2013

Swiss gold refiners have struggled to provide 40 tonnes of gold-a-week for China!

Secretive Swiss gold refiners have been working flat out all year to supply China with physical gold, at times struggling to find the gold supplies required to fulfill ballooning orders.According to this highly reputable source the Swiss are really scraping the bottom of the barrel now to find the gold to meet demand from China. In 37 years this refinery boss has never before experienced this problem. Some of the bars being refined are from the 1960s, from the back of the vaults. 

Click Here To Read More At ArabianMoney.com


Wednesday, December 4, 2013

Yuan Passes Euro as 2nd-Most Used Trade-Finance Currency!

China’s yuan overtook the euro to become the second-most used currency in global trade finance after the dollar this year, according to the Society for Worldwide Interbank Financial Telecommunication.
The currency had an 8.66 percent share of letters of credit and collections in October, compared with 6.64 percent for the euro, Swift said in a statement today. China, Hong Kong,Singapore, Germany and Australia were the top users of yuan in trade finance, according to the Belgium-based financial-messaging platform.  The yuan had the fourth-largest share of global trade finance in January 2012 with 1.89 percent, while the euro’s was the second-biggest at 7.87 percent, Swift said.

Tuesday, December 3, 2013

BREAKING: Canadian Maple Leaf Sales Q1-Q3 Already Surpass 2012 Total


As the Fed and Central Banks continue to pump huge amounts of liquidity into the market, investors have been buying record amounts of Canadian Silver Maples.  Demand for the Canadian Gold & Silver Maples hit a record in 2011, but then declined in 2012 as investors started to believe that the monetary authorities had the financial system back under control — an illusion that will cost them dearly in the future.
After the huge take-down of the price of gold and silver during April of this year, demand for the Canadian Silver Maple Leaf bullion coins picked up to record levels.  Not only were Silver Maple sales strong in the second quarter due to the extremely low price of silver, but demand was even greater during the third quarter… hitting a new all time record.
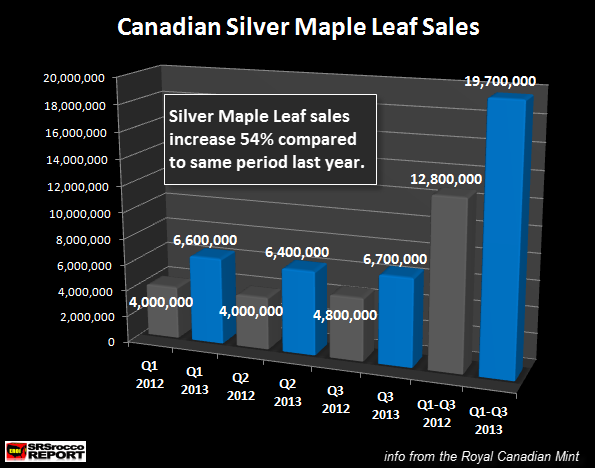
If we look at the chart below, we can see just how much sales of the Canadian Silver Maples have increased compared to the same period last year.
Canadian Silver Maple Leaf Sales Q3 2012
In the first nine months of 2012 total Silver Maple sales were only 12.8 million compared to the 19.7 million sold so far in 2013.  This is a huge 54% increase y.o.y at nearly 7 million more Silver Maples sold.
Again, the third quarter sales of Silver Maples hit a record of 6.7 million compared to 4.8 million in the same period last year.  This is the same phenomenon taking place with Silver Eagle sales.  Sales of Silver Eagles increased in the third quarter at 11.0 million compared to 10.8 million in Q2 2013.
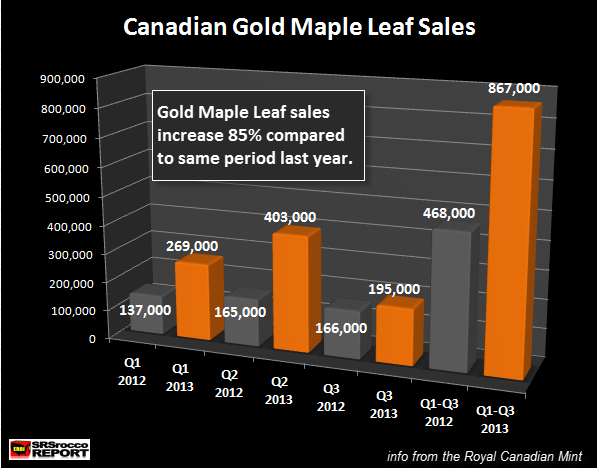
Furthermore, Gold Maple Leaf sales in the third quarter are still quite strong even though demand has dropped off compared to the previous quarter.
Canadian Gold Maple Leaf Sales Q3 2012
Sales of Gold Maples are up a staggering 85% in 2013 at 867,000 ounces compared to the first nine months in 2012 when only 468,000 were sold.  Actually, Gold Maple sales are holding up much better than Gold Eagle sales.
Gold Maple vs Gold Eagle Sales (ounces)
Gold Maple Q1 = 269,000
Gold Maple Q2 = 403,000
Gold Maple Q3 = 195,000
Total Q1-Q3 = 867,000
Gold Eagle Q1 = 292,500
Gold Eagle Q2 = 336,000
Gold Eagle Q3 = 75,000
Total Q1-Q3 = 703,000
Here we can see that Canadian Gold Maples sold 195,000 oz during the third quarter compared to 75,000 oz of Gold Eagles.  So, in the first nine months of 2013, Gold Maples have sold 23% more (164,000 oz) than Gold Eagles.

Gold & Silver Maples Sales Already Surpass 2012 Totals

Demand for the Gold & Silver Maple Leaf coins have been so strong in the first three-quarters of 2013 that they have already beat the total figures for 2012:
Canadian Gold & Silver Maple Sales Q3 vs 2012
Total Silver Maple Leaf sales in the first nine months of 2013 were 19.7 million, surpassing the total 18.1 million for 2012.  In addition, Gold Maple sales are already 12% higher at 867,000 oz compared to 772,000 oz for the total in 2012.
If this strong sales trend continues, we may see another ALL TIME RECORD in Silver Maple sales in 2013.  In 2011, the Royal Canadian Mint sold 23.1 million Silver Maples which is only 3.4 million more than has been sold in the first three-quarters of 2013.
I would imagine we are going to see at least an additional 4.5-5 million Silver Maples sold in the last quarter which would bring the total for 2013 to be 24.5-25 million.  I don’t believe Gold Maple sales in 2013 will surpass their record of 1,150.285 set in 2011.  We would have to see more than 284,000 oz of Gold Maple sold in the remaining quarter of 2013 to beat this record.
This just goes to show how much more investors are buying Silver Maples & Eagles compared to their gold cousins… the Gold Maples & Eagles.
I believe silver will outperform gold in percentage terms as an investment and store of value in the next several years.  As I have mentioned several times in prior articles, the Fed and monetary authorities can print money, but they cannot print Silver, Gold or Barrels of Oil.
As gold revalues much higher in the future, most of the public will only be able to purchase silver as its price will be more afordable.  Thus, the demand for silver will be much greater than gold, pushing its value up to levels that the present disgruntled precious metal investors would believe impossible.

Sunday, December 1, 2013

October Chinese gold imports from HK massive 131 tonnes

Far from slowing down, net Chinese gold imports through Hong Kong accelerated in October to 131.2 tonnes according to figures sent to Reuters today - the seventh month this year that China has imported over 100 tonnes of gold and the sixth in a row. 

Click Here To Read More From MineWeb:

Tuesday, November 26, 2013

In The Future, You May Have To Pay The Bank To Hold Your Money!

The economy is stuck in a weak recovery and unemployment remains high, but the Federal Reserve long ago exhausted the normal tool it uses to spur economic growth.
Now, it is considering a policy change that could lead banks to charge depositors negative interest rates.


Read more: http://www.businessinsider.com/in-the-future-you-may-have-to-pay-the-bank-to-hold-your-money-2013-11#ixzz2ljyMv3QE