As the Fed continues with its Quantitative Easing policy, U.S. gold bullion exports hit a new record in the first nine months of 2013. While it’s no secret to anyone in the precious metal community, the majority of U.S. gold exports found their way to Hong Kong and Switzerland.
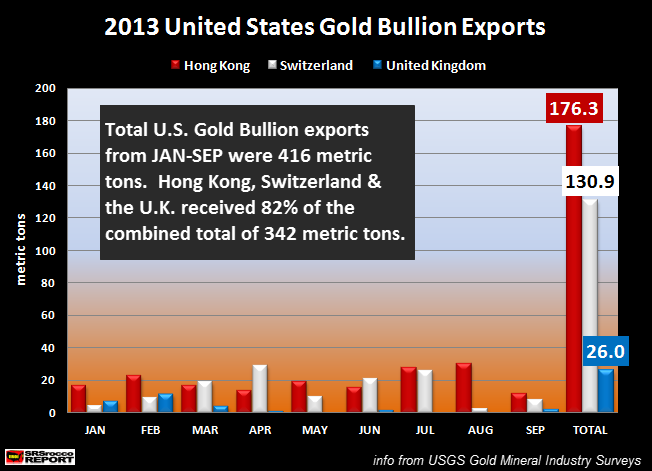
Not only have gold bullion exports hit new records during Jan-Sept, they have already surpassed the total for 2012. If we look at the chart below, we can clearly see who has received most of the gold.
In the first nine months of 2013, Hong Kong received 176.3 mt (metric tons), Switzerland 130.9 mt and the United Kingdom 26 mt. Of the 416 mt of U.S. gold bullion exports Jan-Sept, these three countries received 342 mt or 82% of the total.
Why is this such a big deal? Because in the first nine months of 2012, total U.S. gold bullion exports were only 283 mt compared to the 416 mt so far this year. Which means the United States has exported 47% more gold bullion at an additional 133 mt compared to the same period last year.
Furthermore, total U.S. gold bullion exports in 2012 were only 371 mt compared to the 416 mt in the first nine months of 2013.
As the price of gold started to decline in March of this year, including the huge take-down in April, U.S. gold bullion exports picked up significantly:
The number of gold bullion exports increased from 40.1 mt in Jan to 62.1 mt in April. Then we can see they fell in May (38.1 mt) and June (40.7 mt) as the gold buyers were waiting to see if prices would stop falling. And in June, the price of gold finally bottomed right below $1,200 level.
What is interesting to see here is that there were a higher amount of gold bullion exports in July (64.4 mt) than in April (62.1 mt)
As the price started to rise in July, gold exports to Hong Kong & Switzerland picked up substantially. The table below details which countries were the recipients of U.S. gold bullion exports.
Not only did Hong Kong increase its gold bullion imports from the U.S. in July to 27.9 mt up from 15.5 mt in June, but it jumped even higher in August when it reached a 30.7 mt — a record month for the year.
According to the data from the USGS Gold Mineral Industry Surveys for Jan-Sept 2013, Hong Kong has received a total of 176.3 mt and Switzerland 130.9 mt. The United Kingdom came in third at 26 mt while Thailand came in fourth at 21. mt, followed by South Africa at 19.5 mt, Canada at 15.3 mt, China at 11 mt and India at 2.7 mt.
There was an additional 13.5 mt that went to several misc. countries in which the United Arab Emirates received the greater share.
Now, I want to make something clear here. These figures only represent “Gold Bullion” exported out of the United States. There are also two other categories that come under the heading of gold exports beside manufacturing and scrap supply. We also have the following:
JAN-SEPT Gold Exports:
Ores & Concentrates = 5.1 metric tons
Dore’ & Precipitates = 152 metric tons
If we add up all the three categories of U.S. gold exports we have total of 573 metric tons for the first nine months of 2013. This turns out to be a significant trend when we factor in several other figures.
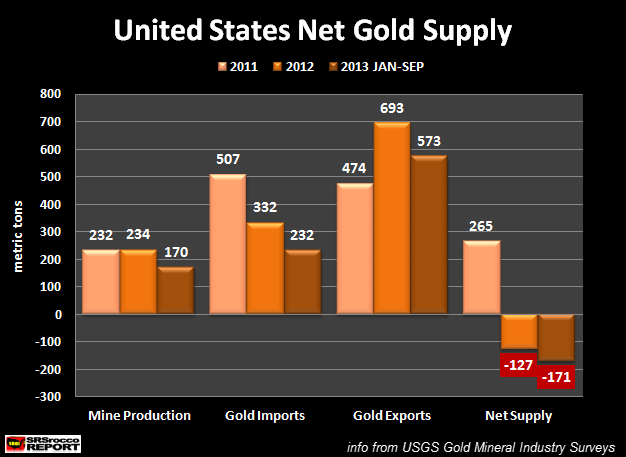
As U.S. gold exports increased in 2012, its imports have fallen considerably. The chart below shows the change in U.S. net gold supply:
The chart is broken down into four components; Mine Production, Gold Imports, Gold Exports and Net Supply. There is no real change in U.S. gold mine supply, but we can certainly see that gold imports have fallen off dramatically since 2011.
U.S. gold imports fell to 332 metric tons in 2012 down from 507 metric tons in 2011. I would imagine overall gold imports in 2013 will be about the same as they were in 2012 when we receive the remaining four months of data from the USGS.
However, the big change here is the large increase of U.S. gold exports. Total gold exports out of the U.S. increased from 474 mt in 2011 to 693 mt in 2012. Currently, the United States has exported 573 mt, 45 mt more than the same period last year.
Compiling all the figures for the past three years (including only Jan-Sept 2013), the United States has a negative 171 mt of net gold supply so far in 2013. Basically, this means that the U.S. has exported 171 mt more gold than it has produced from its mining sector and imports combined.
In 2011, the U.S. had a positive net supply of 265 mt, but due to high demand for gold abroad this fell in 2012 to a negative 127 mt. And as you can see, U.S. net gold supply continues to decline — a negative 298 mt since the beginning of 2012.
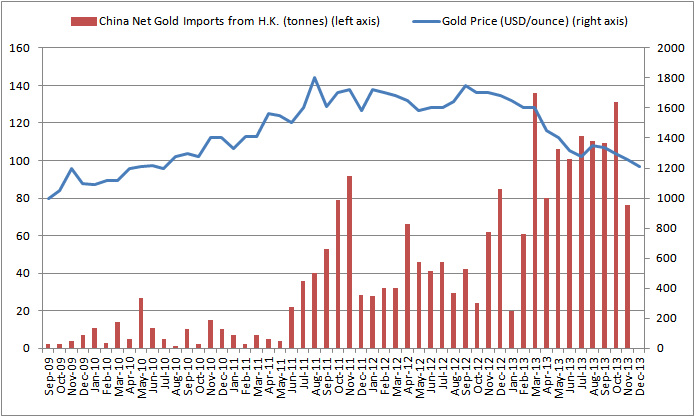
It will be interesting to see what takes place for the remainder of the year. If we consider that Hong Kong had record gold imports in October, I would imagine the U.S. supplied a good portion of this amount.
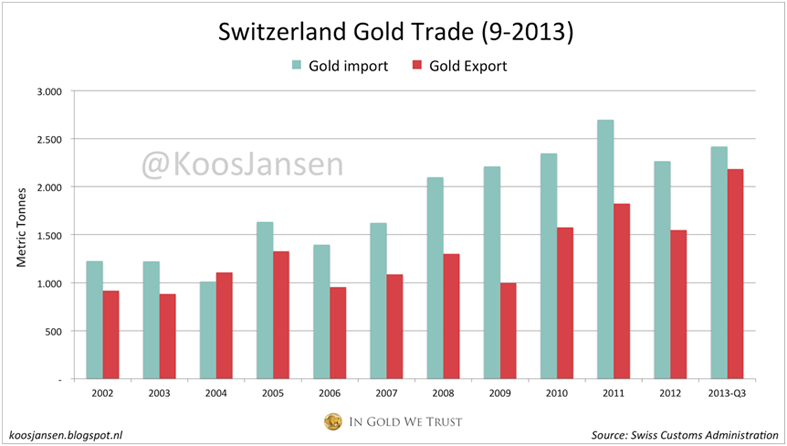
Lastly, when we realize that the majority of U.S. gold exports to Switzerland and the U.K. are probably making their way to the East…. we can assume that the overwhelming majority of the gold leaving the shores of the United States is most certainly ending up in China.


.png)


